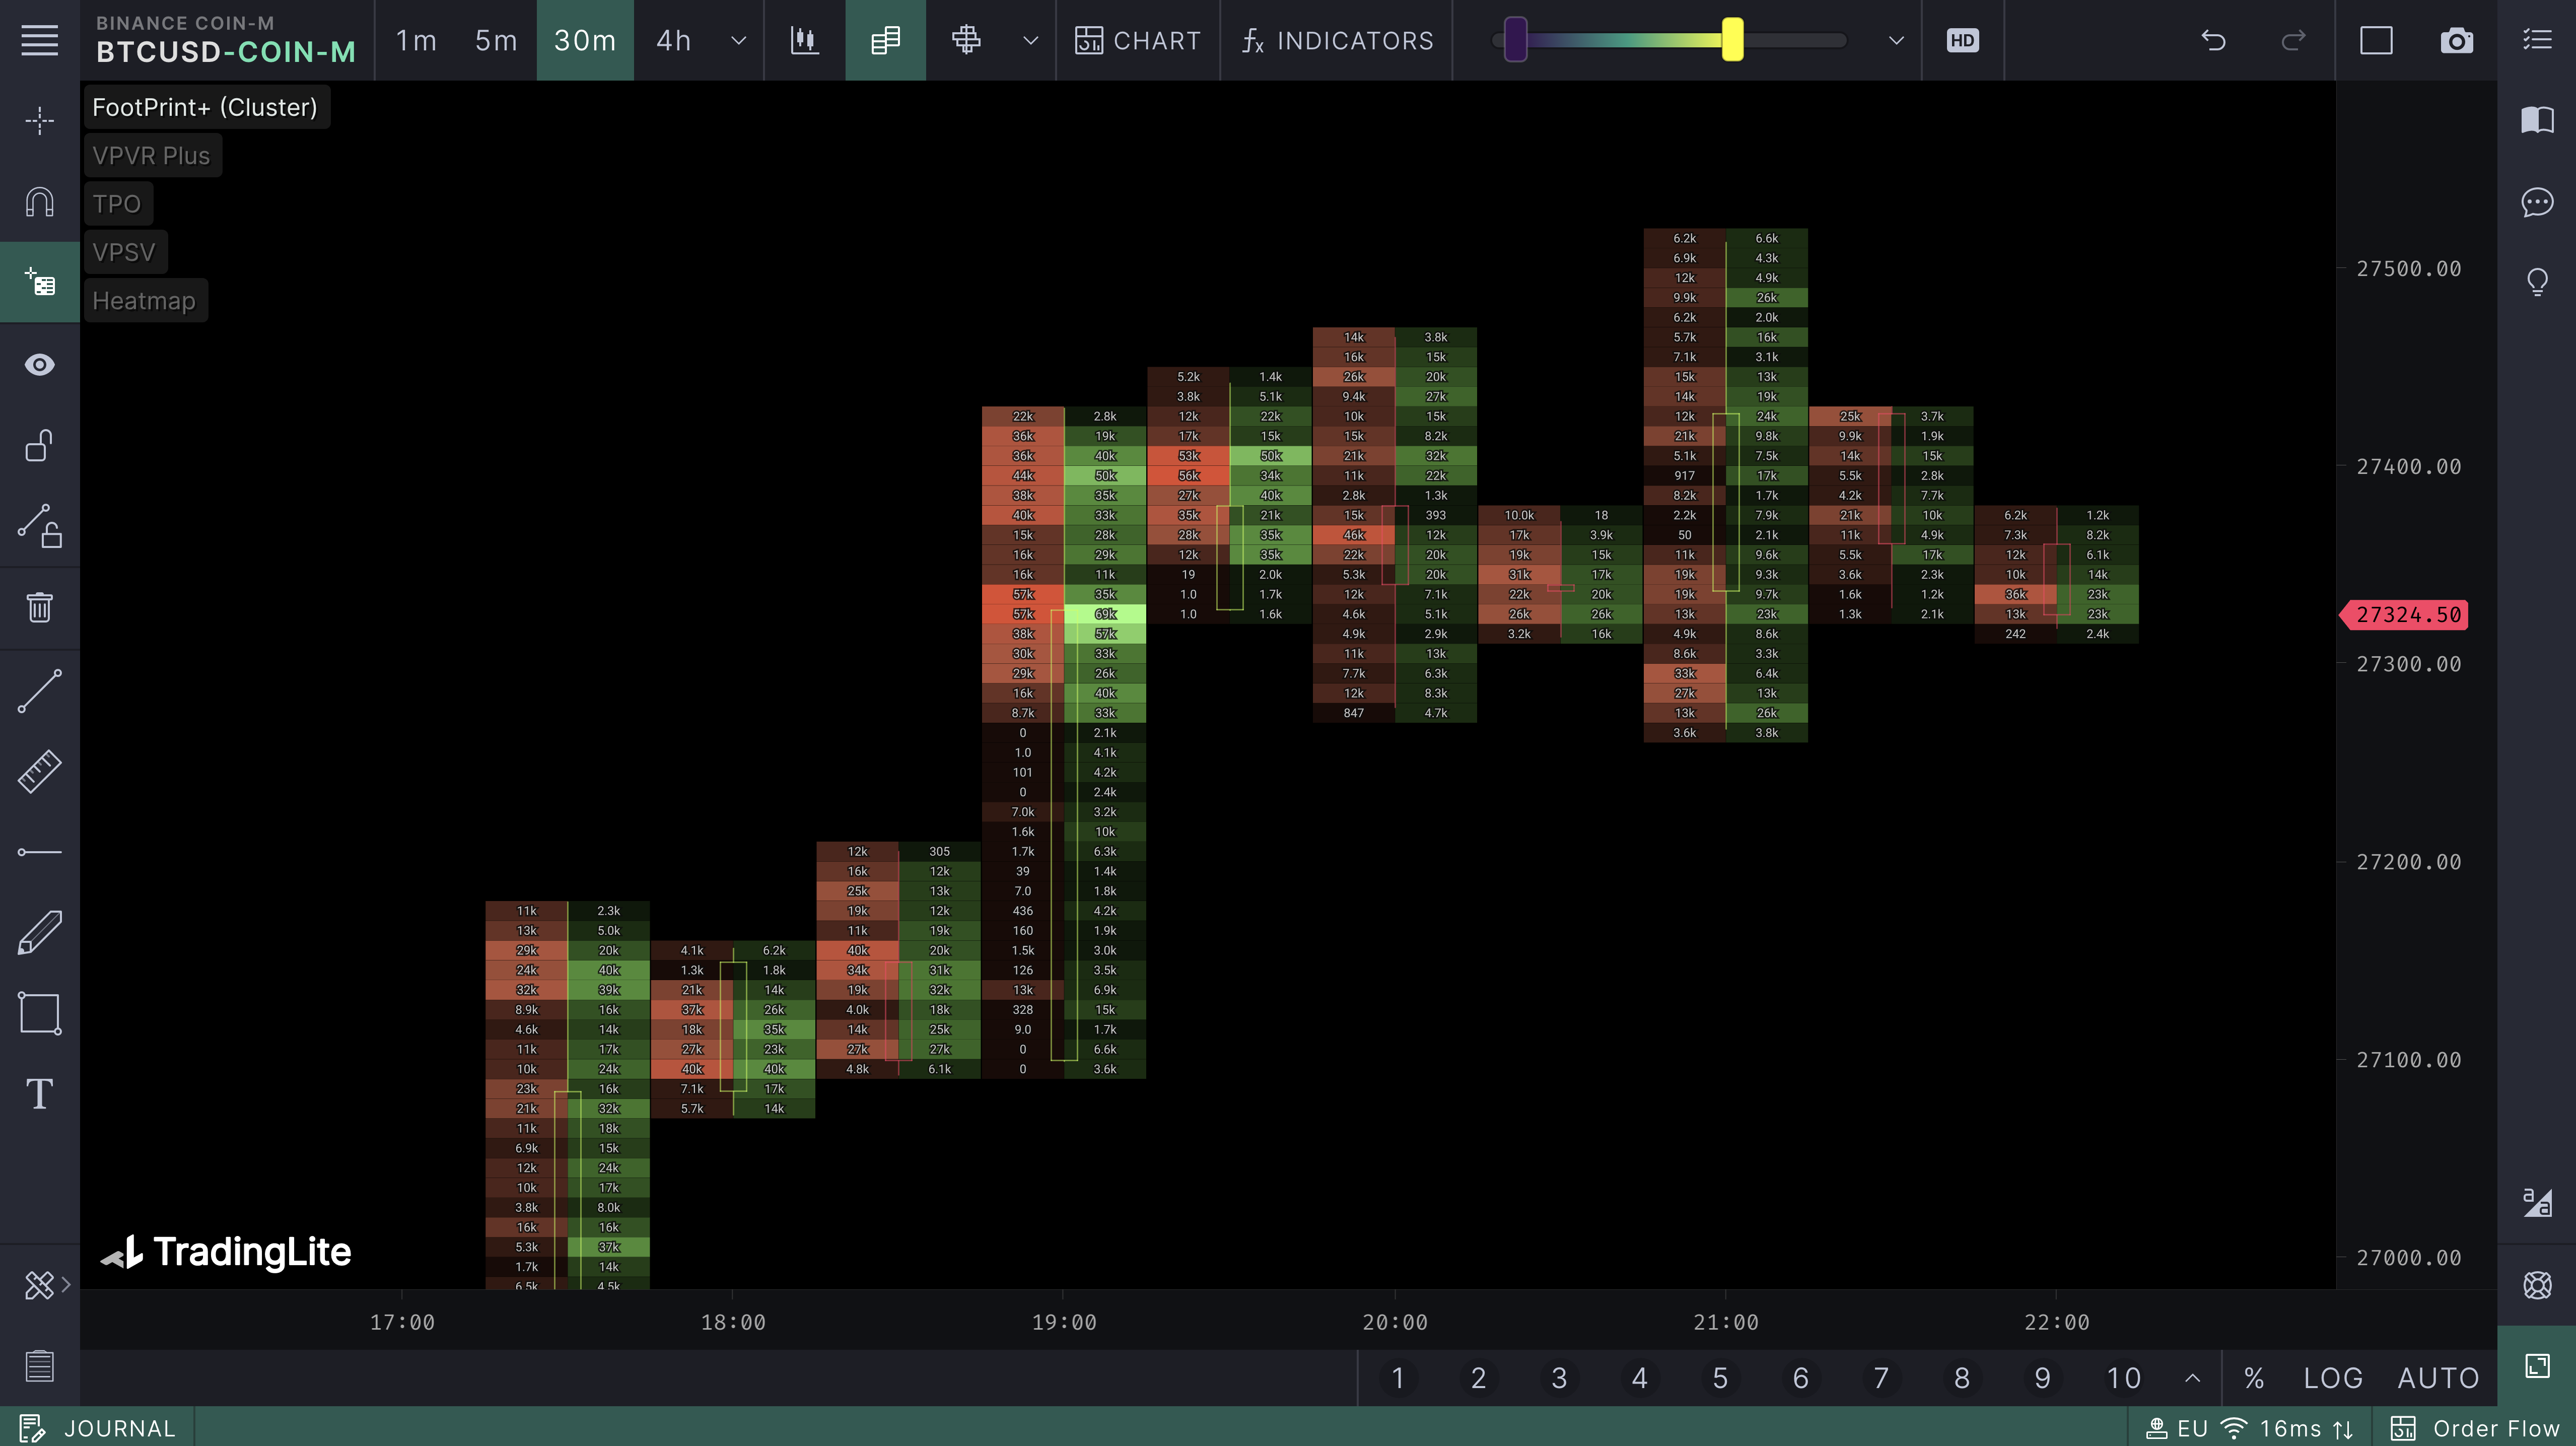
As one of TradingLite's core features, this guide will review the basic components of the heatmap and its functionality.

Overview

The TradingLite Heatmap is a visual record of historical liquidity within the Order Book.

🔥

They show the total value of:

  • Limit sell orders, above price

  • Limit buy orders, below price

Updated in real-time, it also shows the current liquidity of the market. Watching the heatmap above and below the current price you will see the heatmap changing rapidly as limit sell and limit buy orders are added and removed from the Order Book.

🔬

At the end of each candle's life, a snapshot of the Order Book (liquidity) is captured. These snapshots collectively form the heatmap.

Heatmap Blocks

TradingLite's Heatmap consists of a grid of blocks, each with a specific color / intensity that represent the strength of supply (limit sell orders) or demand (limit buy orders), at that price and time.

tutorial1[1].png

Blocks may change color or disappear as time passes.

🔬
  • If a block changes color, the value of orders at that price is changing.

  • If a block disappears, the value of orders at that price is now zero.

Heatmap Intensity Slider

TradingLite gives you the ability to configure how the heatmap’s data is rendered. This is achieved by using the intensity slider within the top toolbar. The slider’s colors serve as a legend, for the Heatmap.

heatmap-sliders

The slider on the left determines the minimum value of orders to be displayed within the Heatmap.

🔬

This will filter/remove blocks with a smaller value.

The slider on the right determines the peak value of orders on the Heatmap.

🔬

This will determine the range and intensity of the heatmap's color scale.

HD/SD Heatmap Block Size

HD-SD-Heatmap

The benefit of a lower block size/incremental value, by (HD) being selected, is that the Heatmap will provide the location of limit orders/liquidity within the Order Book with a substantial 5 x greater accuracy than the standard (SD) option.

💡

HD heatmaps are only available to Gold subscribers.

Upgrade your plan to gain access to 5 x greater heatmap accuracy.

Heatmap Themes

You can change the Default Theme by navigating to: Chart Settings > Theme

heatmap-themes

Themes aren’t just for aesthetics, they are finely-tuned for different visualisations.

Extend Heatmap

The Heatmap can be extended to help visualise the current supply/demand liquidity pools, with greater clarity.

To extend the Heatmap:

  • Click Chart Settings

  • Select Heatmap

  • Select the desired value of blocks to extend via: Extend Heatmap

💡

Whilst this guide has covered the basics, you should also consider viewing the Heatmap Advanced guide, for a full, in-depth masterclass.

Was this page helpful?


Related content