Footprints Basics
View market sells and buys, at various price points, within a footprint candle.
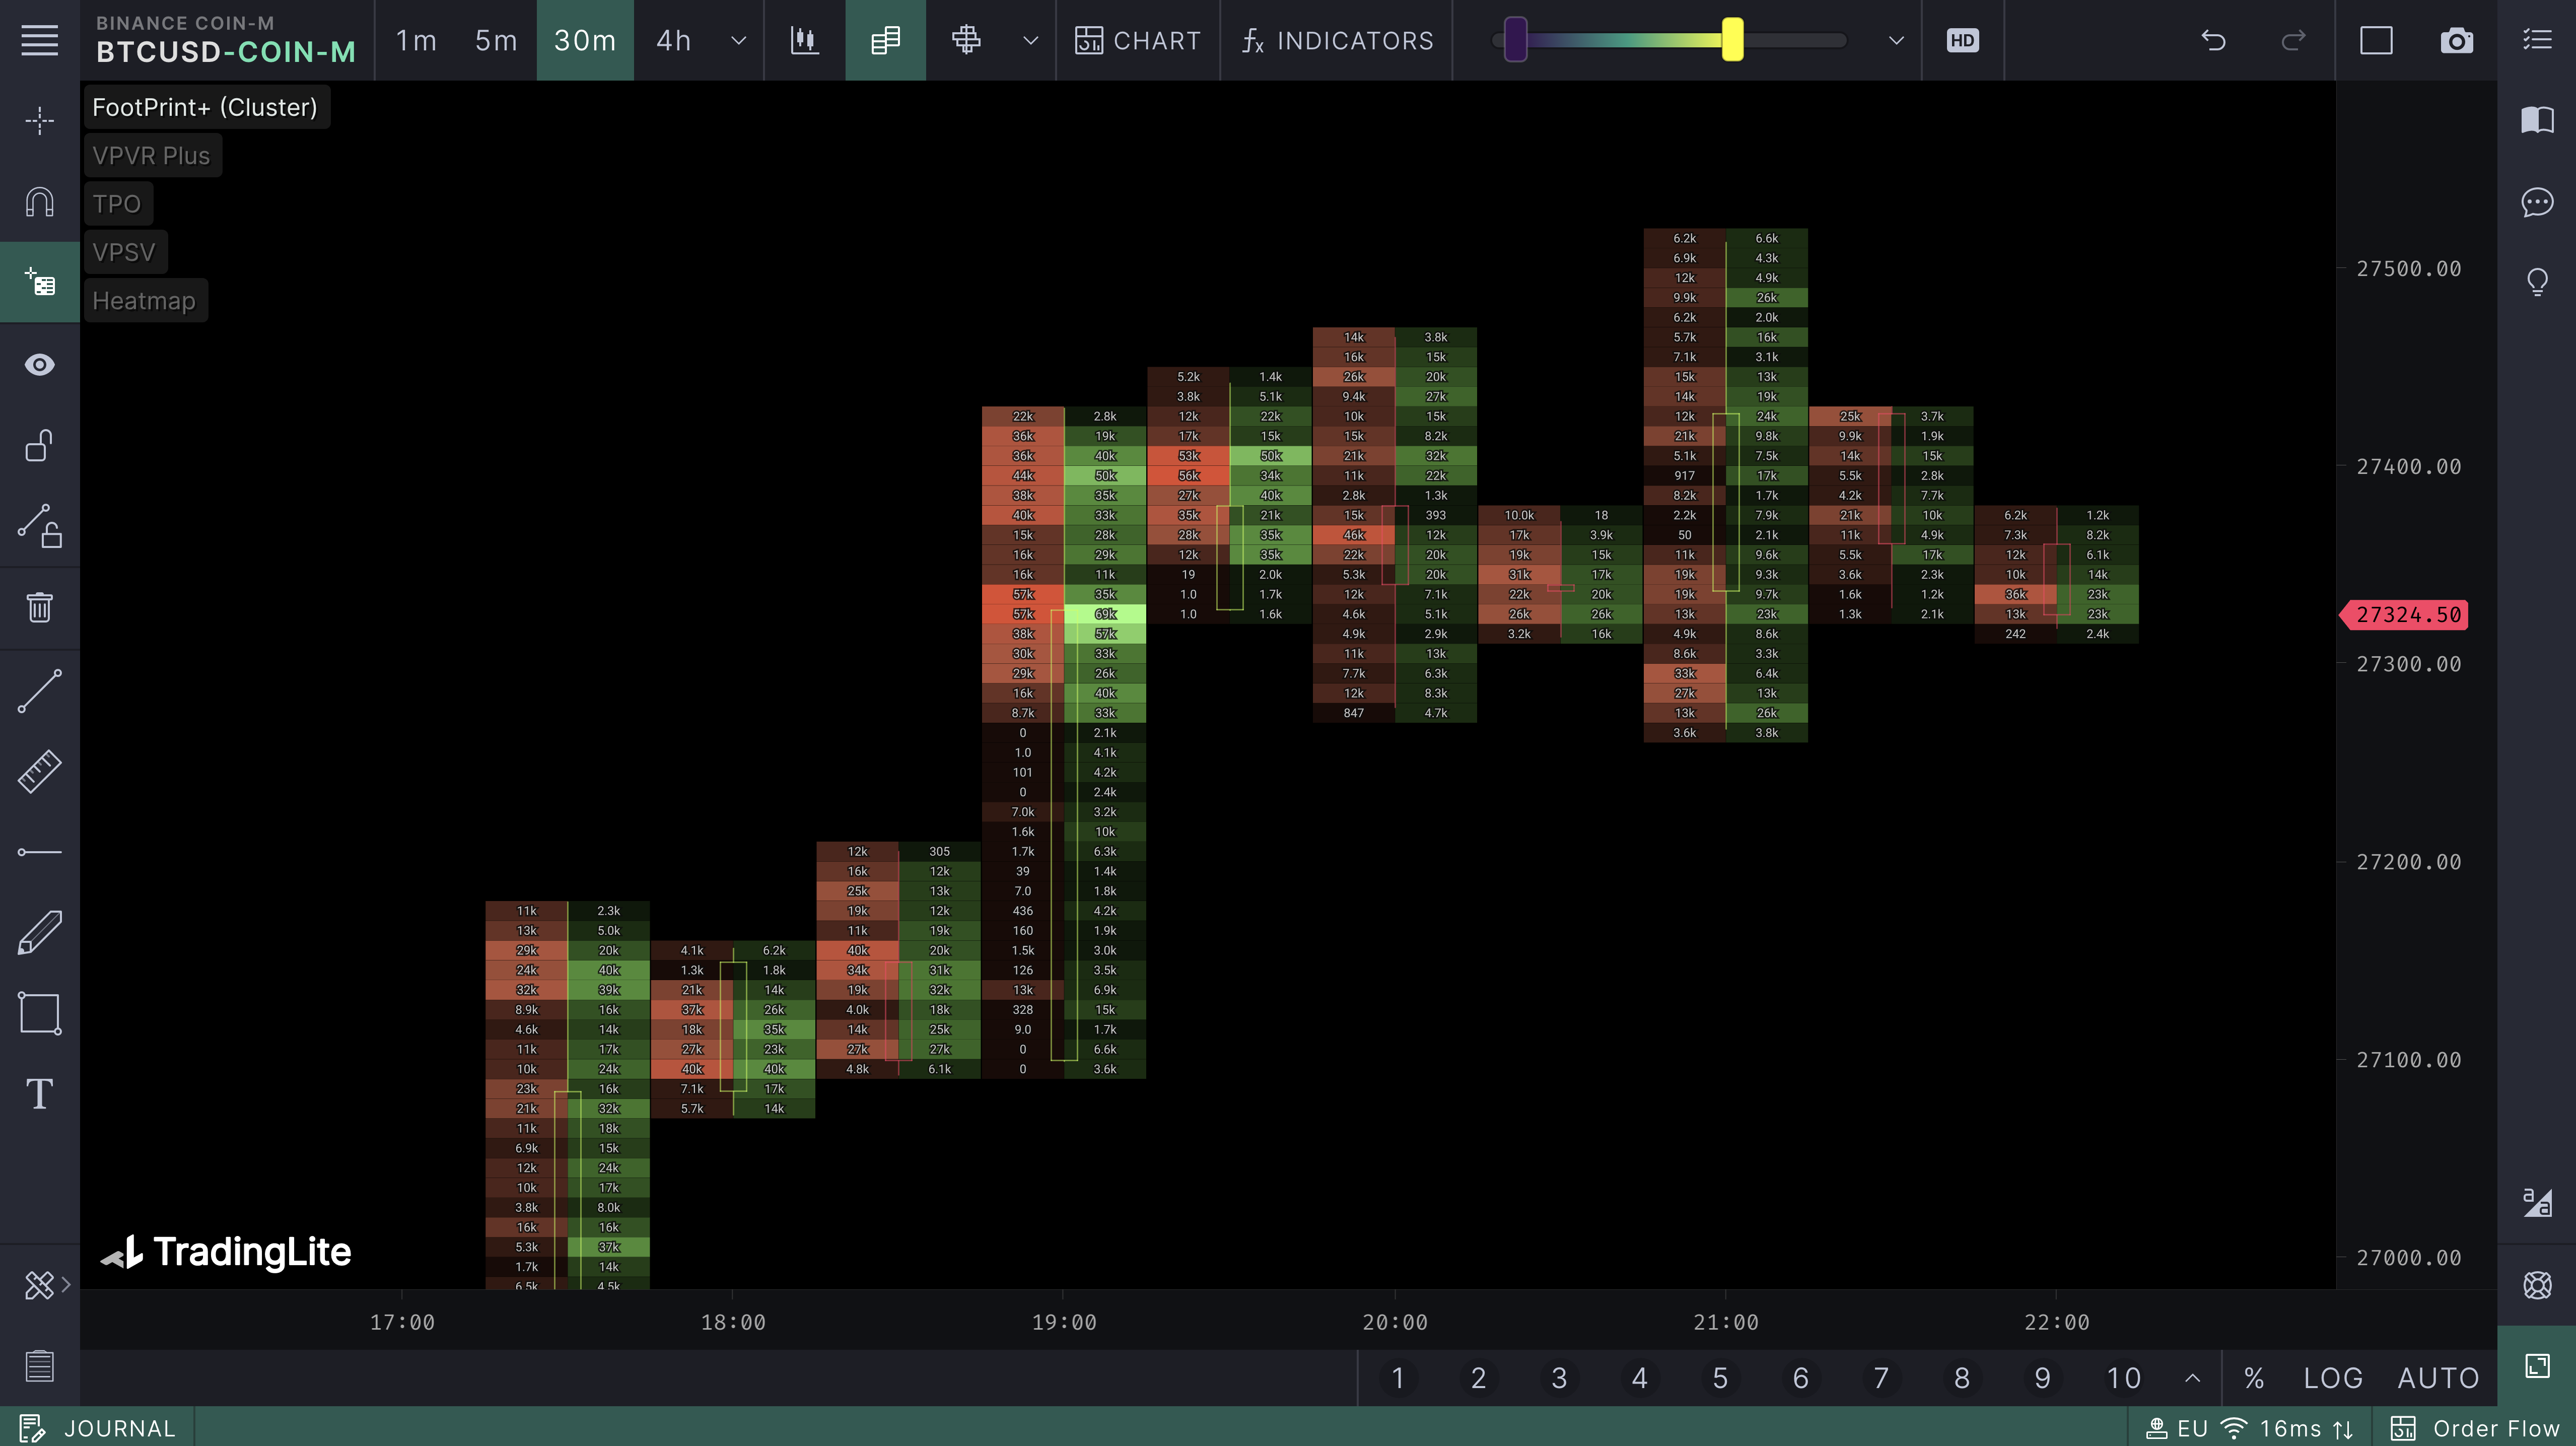
Footprint charts allows you to observe market buy, and market sell pressure, at various price points.
There are currently 2 styles of Footprints within TradingLite, Footprint Profile and Footprint Cluster.
For both Profile and Cluster, there is the Default view and the Delta view.
It is strongly recommended that you try both Default and Delta views, to determine you preference.
To enable Footprints: Chart Settings > Official Indicators > Footprint Profile/Cluster
Footprint profile data is displayed within a standard candlestick.
In addition to the candle's Open, High, Low & Close;
Displayed as a profile, the greater the value of market buys or market sells, the wider the colored row represented at each price point.
TradingLite also provides Footprint Cluster which could be considered as a simplified version of the Footprint Profile.
As before:
For both Footprint Profile and Footprint Cluster, there are configurable options available to suit your requirements:
This value defines the number of price points that are grouped together to form each row within the Footprint.
Selecting this option will provide the Delta for each row, that determines whether the market sells or market buys were more dominant, and by what value.
Footprint Profile Delta:![]() |
Footprint Cluster Delta:![]() |
As a core feature of TradingLite, we also recommend you take a moment to view at our in-depth Footprints Advanced guide.