Toolbar Navigation
This quick article will guide you throughout all of the various toolbars available within your working area on TradingLite.
Tags: The aim of this Toolbar Navigation guide is to breakdown each part of the core TradingLite user-interface.
We strongly recommend having this guide open in one tab, whilst having the TradingLite platform open in another, in order to follow along. If you have not done so already, you can sign up here.

At the top, from left to right, you will find options to select:
Notifications / Workspace / Account Settings
Chart Settings
Indicators
Heatmap Settings
HD/SD Heatmap (Note: HD only available to Gold Subscribers)
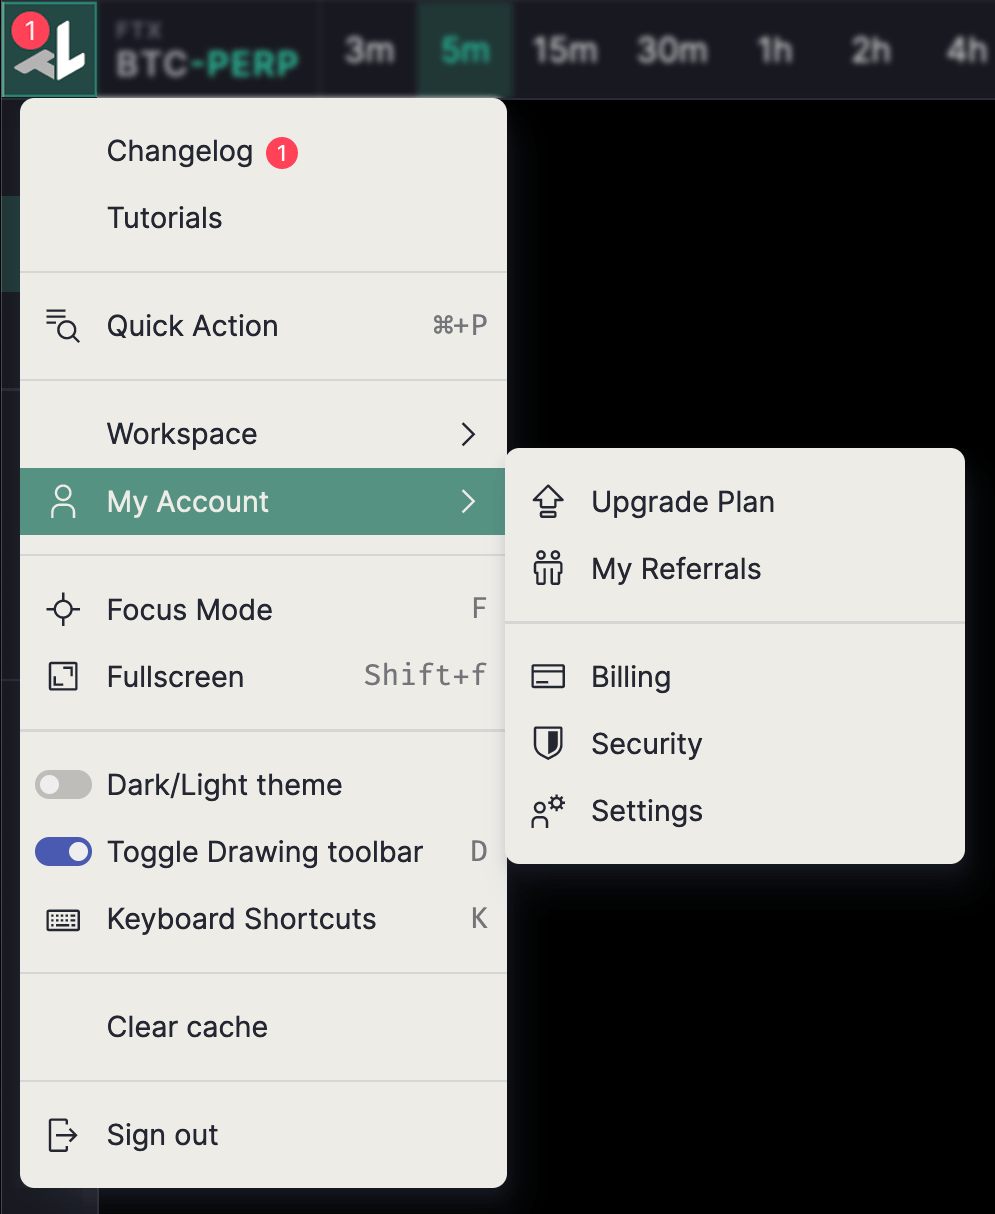
Clicking the TradingLite Logo button will provide you quick access to key information, account management links and user-interface settings.
 |
Hovering will provide you with a list of of your favourited pairs.
Clicking, will allow you the ability to search and select a pair from all those supported on TradingLite.
By pressing the star icon, to the left of the pair, you will pin that particular pair to a Favourites list. Your Favourites list will be shown when you hover over the pair selection button in future. Once added to your Favourites, you can re-order your list by dragging and dropping into your desired sequence.
Current timeframes that are supported include:
1m, 3m, 5m, 15m, 30m, 1h, 2h, 4h, 6h, 8h, 12h, Daily.
By pressing the star icon, to the left of the timeframe, will pin that particular time-frame to the top toolbar, for quicker selection in future.
Main is the initial layer used to display price in a candlestick chart. In addition to traditional candles, TradingLite offers 7 additional alternative methods to display price, to suit your preference. Candles, Heiken Ashi, Line, Stepped Line, Area and Baseline are pictured below.
Footprint Cluster and Footprint Profile are also available, however they are shown and explained within the dedicated Footprint Basics and Footprint Advanced guides.
As with most elements that have a range of choices, you are able to Favourite different chart types, allowing for quick selection in future.
Note that Footprints from favourites are composite layers, meaning that they're composed of two indicators (candles & footprints).
If you only want the Footprint itself, as a separate layer, add it via Indicators > Official Indicators.
Chart Settings, Indicators, Heatmap (Intensity Slider & HD button) are all explained within their own dedicated pages available below:
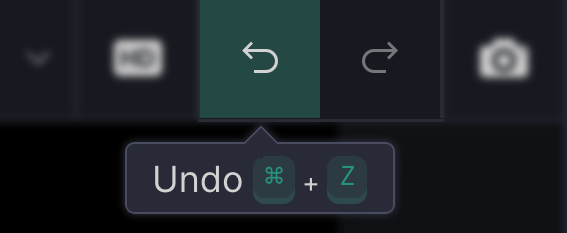 | Despite being an easily forgotten feature, the Undo / Redo buttons help you quickly revert changes. This also includes changes to pair selection and inputs from indicators. |
Split-View allows you to view multiple charts at the same time, all whilst keeping your chosen layout and theme preferences.
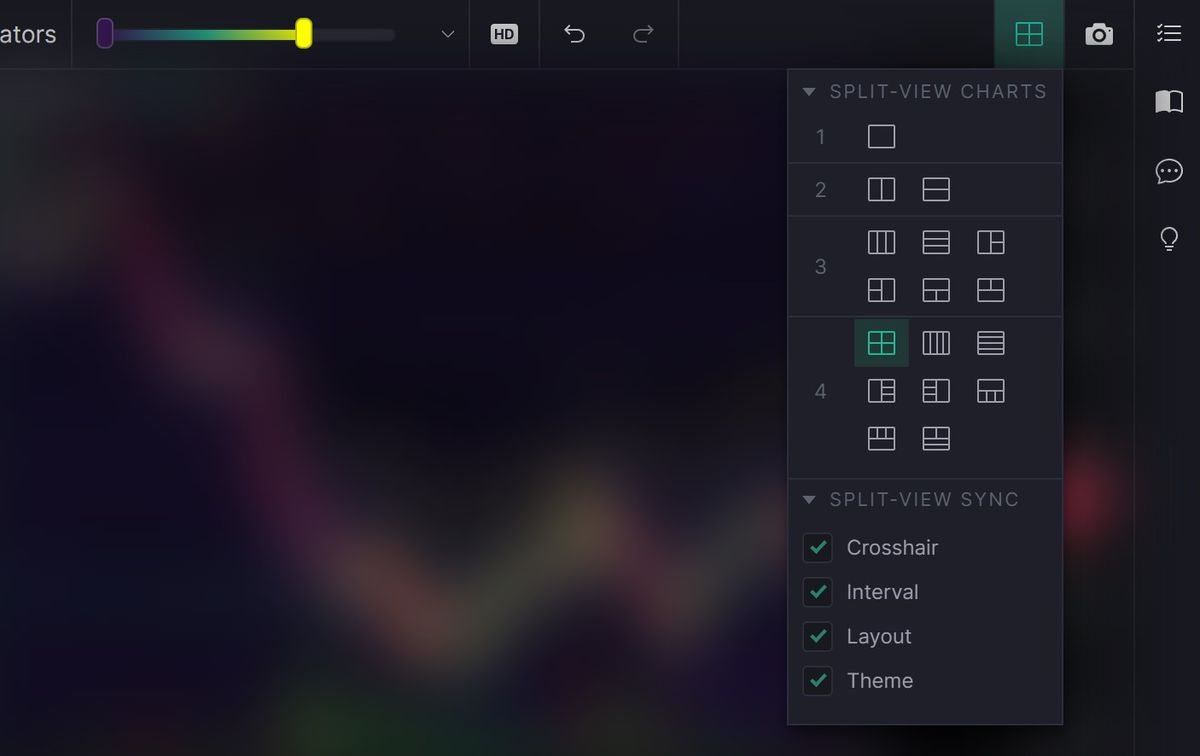
Start by pressing the Split-View button and select your desired multiple chart layout. Ensure you select the various sync options to maintain your original layout and a theme. For more info see our dedicated Split-View learning page:
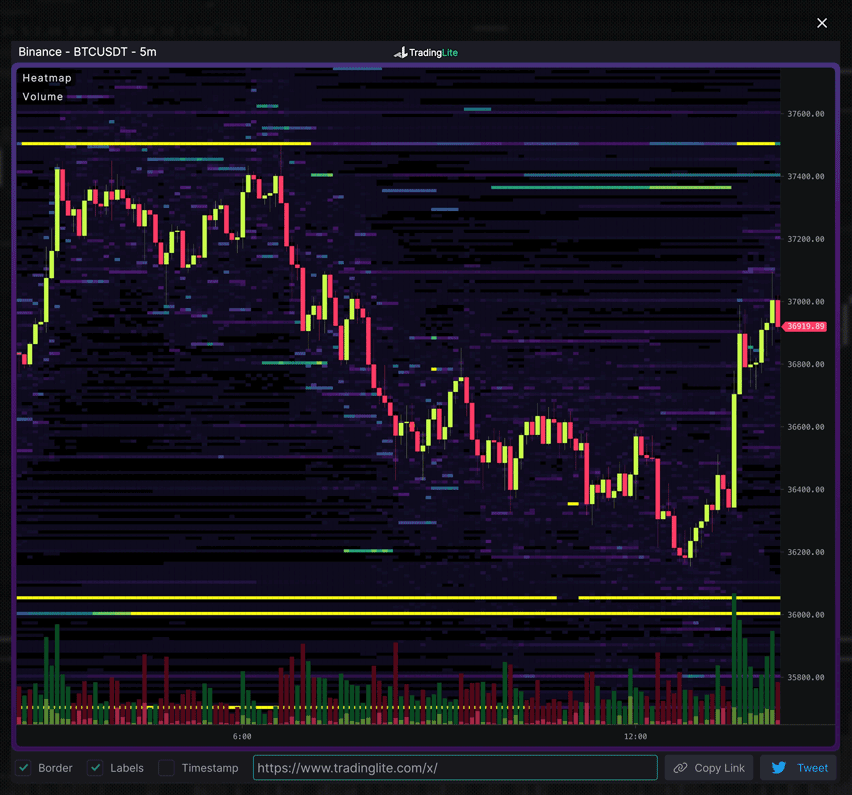
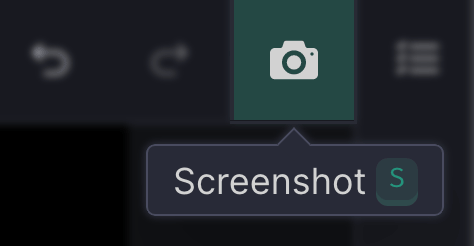 | Should you wish to publish an image of the current view of your chart, clicking the screenshot button will provide you with a clean, toolbar free image to share. |
Upon clicking the Screenshot button, you have the additional options to show or hide the Borders, Labels and Timestamp.
Within the Status Toolbar, you will find (right to left):
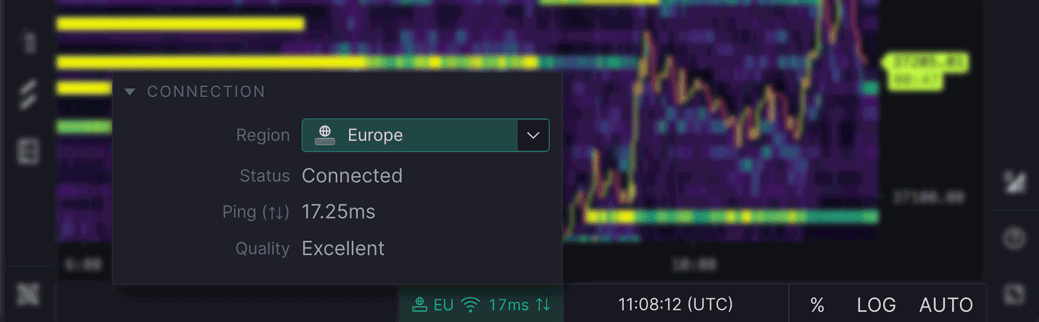
Connection Status/Server Selection
Time/Timezone Selection
Percent Scale
Logarithmic Scale
Auto Scale
If the connection status is providing evidence of some from of degradation, please follow the steps listed here.
After following the steps listed listed in our help center, if you are still experiencing issues, contact us.
When hovering over the chart's bottom center where the time axis is located, the following navigation shorts will be shown:
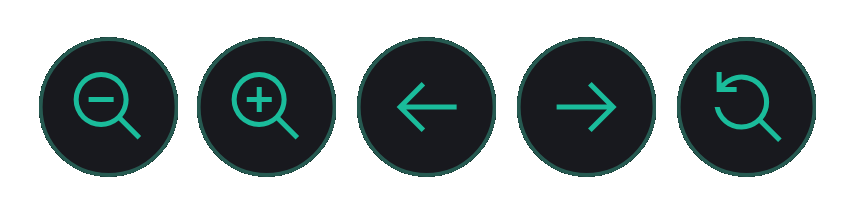
Zoom out & Zoom in, this can also be achieved using keyboard shortcuts or right-click drag zoom.
Move Left & Move Right, moves the time axis by one candle.
Reset View, resets the view to its original zoom and position.
To the upper-right, you will find toggles for:
Trade Feed | 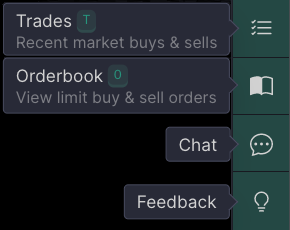 |
Please see our dedicated Trade Feed & Order Book guides that explain, in detail, all of the options and features, they each respectively offer.
To the bottom right, you will find toggles for:
Invert Colors | 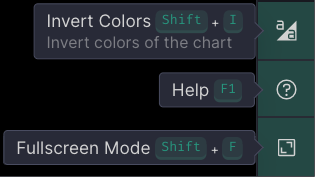 |
Please see our dedicated Drawings guide that demonstrates the flexibility and customisability of TradingLite’s Drawing Tools.
Was this page helpful?