Footprint Cluster
TradingLite's Footprint Cluster uses color grading to denote the value of market orders at each price point.
Tags: TradingLite's Footprint Cluster is one of two primary methods with which to view the order-flow of market sells and market buys. Unlike its Profile based equivalent, TradingLite's Footprint Cluster opts for color grading to denote the value of market orders at each price point.
In this article, we will explore the options to configure both the Footprint Cluster, and Footprint Cluster Plus layers.
Note that the Footprint Cluster Plus layer is only available to Gold subscribers.
To grasp the fundamentals of Footprint charts, head over to our Footprint Basics learning material. For more more detailed application of our footprint charts, we recommend our Footprint Advanced guide.
Complementing TradingLite's limit order based Heatmap, TradingLite's Footprint Cluster and Footprint Cluster Plus layers provide market sell and market buy volume within each individual candle.
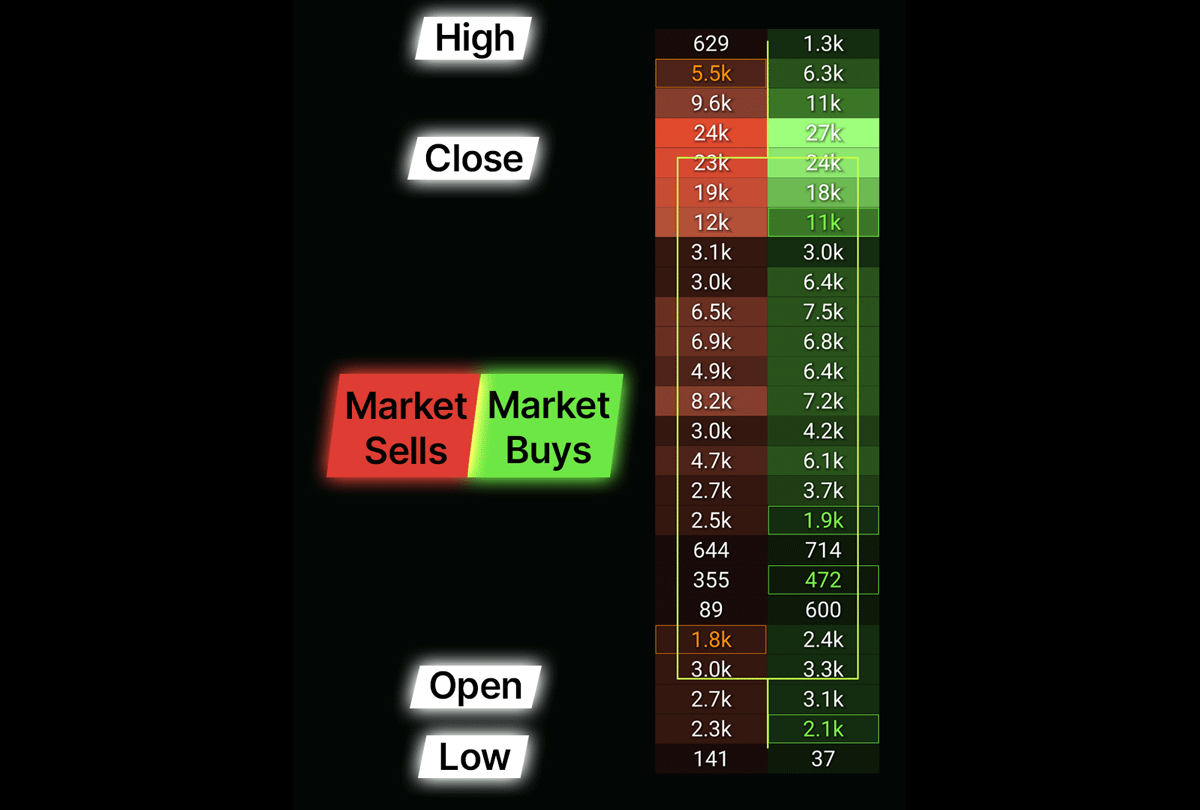
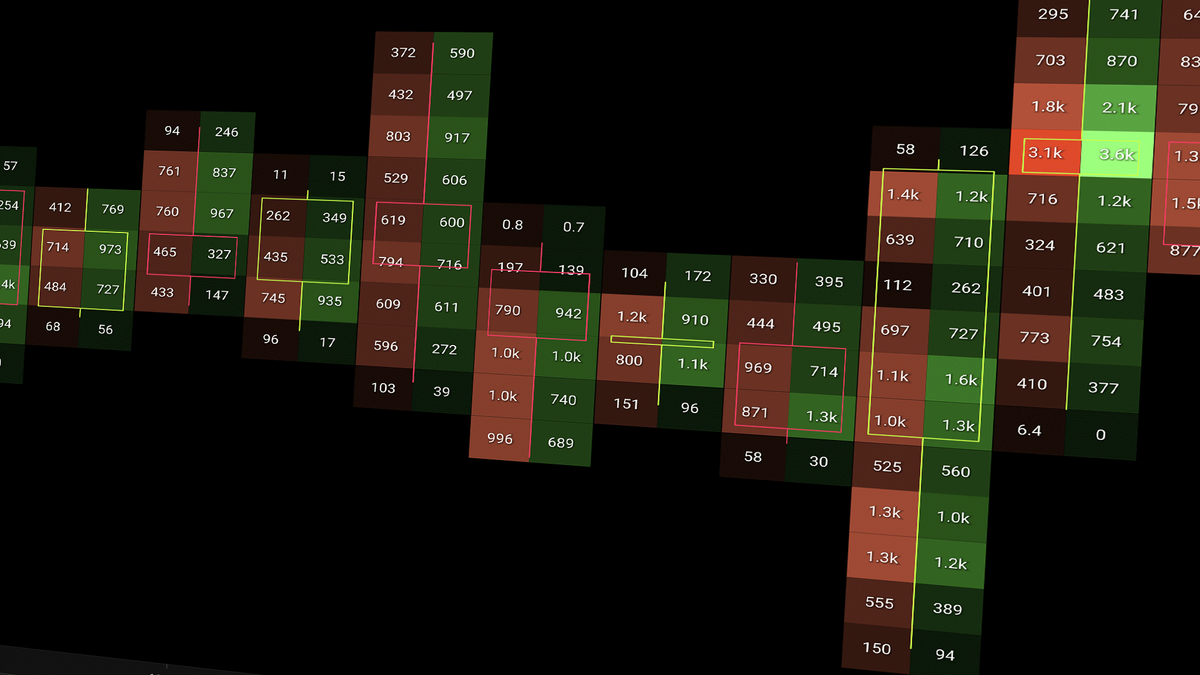
The Footprint Cluster is split between two colour graded columns within each candle.
Market Sells are shown on the left in red.
Market Buys are shown on the right in green.
These columns are then split into rows of price points. The height (or the range of prices) of each row is called the Ticks per Row.
The number shown within each row represents the total value of market orders.
The larger the value of market orders, the brighter the color within the Footprint Cluster.
To ensure that you are fully utilising the Footprint Cluster layer, we will explore the various options and customizations that can be configured.
In addition to the default mode shown above previously, you can also choose between Delta and Imbalance.
Delta Mode, as it's name implies, subtracts the value of market sell orders from the value of market buy orders, within each row. This will return one singular column within each candle, with the colour grading applied to these delta values.
Imbalance mode compares the value of market sells and market buys across price rows diagonally to determine whether there is a disproportional imbalance. This will be shown as a highlighted box.
For more information regarding Footprint Deltas or Footprint Imbalances, please refer to our Footprint Advanced guide.
Color picker to determine the border color of the rows within the Footprint Cluster.
This is the value of ticks that are grouped together to form the price range of each row. A higher Ticks per Row value will amalgamate more price ranges together, whereas a lower Ticks per Row value will provide increased granularity.
By default this is set to 'Proportional'. In this color grading mode a comparison is made between all of the rows across each candle within the session. The brightness of each cluster is the proportionally assigned.
The alternative color grading option is 'Per Candle'. This will assign the color of each cluster within each candle itself, with other candles not having an impact into the color grading.
Rather than the default behavior of your chosen time-frame determining each new Footprint Cluster within each candle, the Minimum Interval setting allows you to merge multiple candles together to form an artificial time-frame.
The Footprint Cluster Plus layer, takes all of the aspects of the original above, and improves upon it with further customization, in addition to adding a range of new features.
Below, we will explore the unique settings of the Footprint Cluster Plus in detail.
Above each candle, the Header will provide you with the two values.
The first, colored value is the overall delta of that candle.
The second value is the total volume.
These headers can be toggled and reordered, to your preference.
Both the Sell and Buy sides of the Footprint Cluster Plus layer can now be configured to suit your own custom styling preferences, with the ability to set three primary graded colors. The color grading algorithm will then take these three primary choices, and grade accordingly, nine levels deep.
Easily highlight the highest volume node within each candle by enabling the Point of Control toggle. Here you will be able to select from a 'Ray' or an 'Outline', in addition to your choice of color.
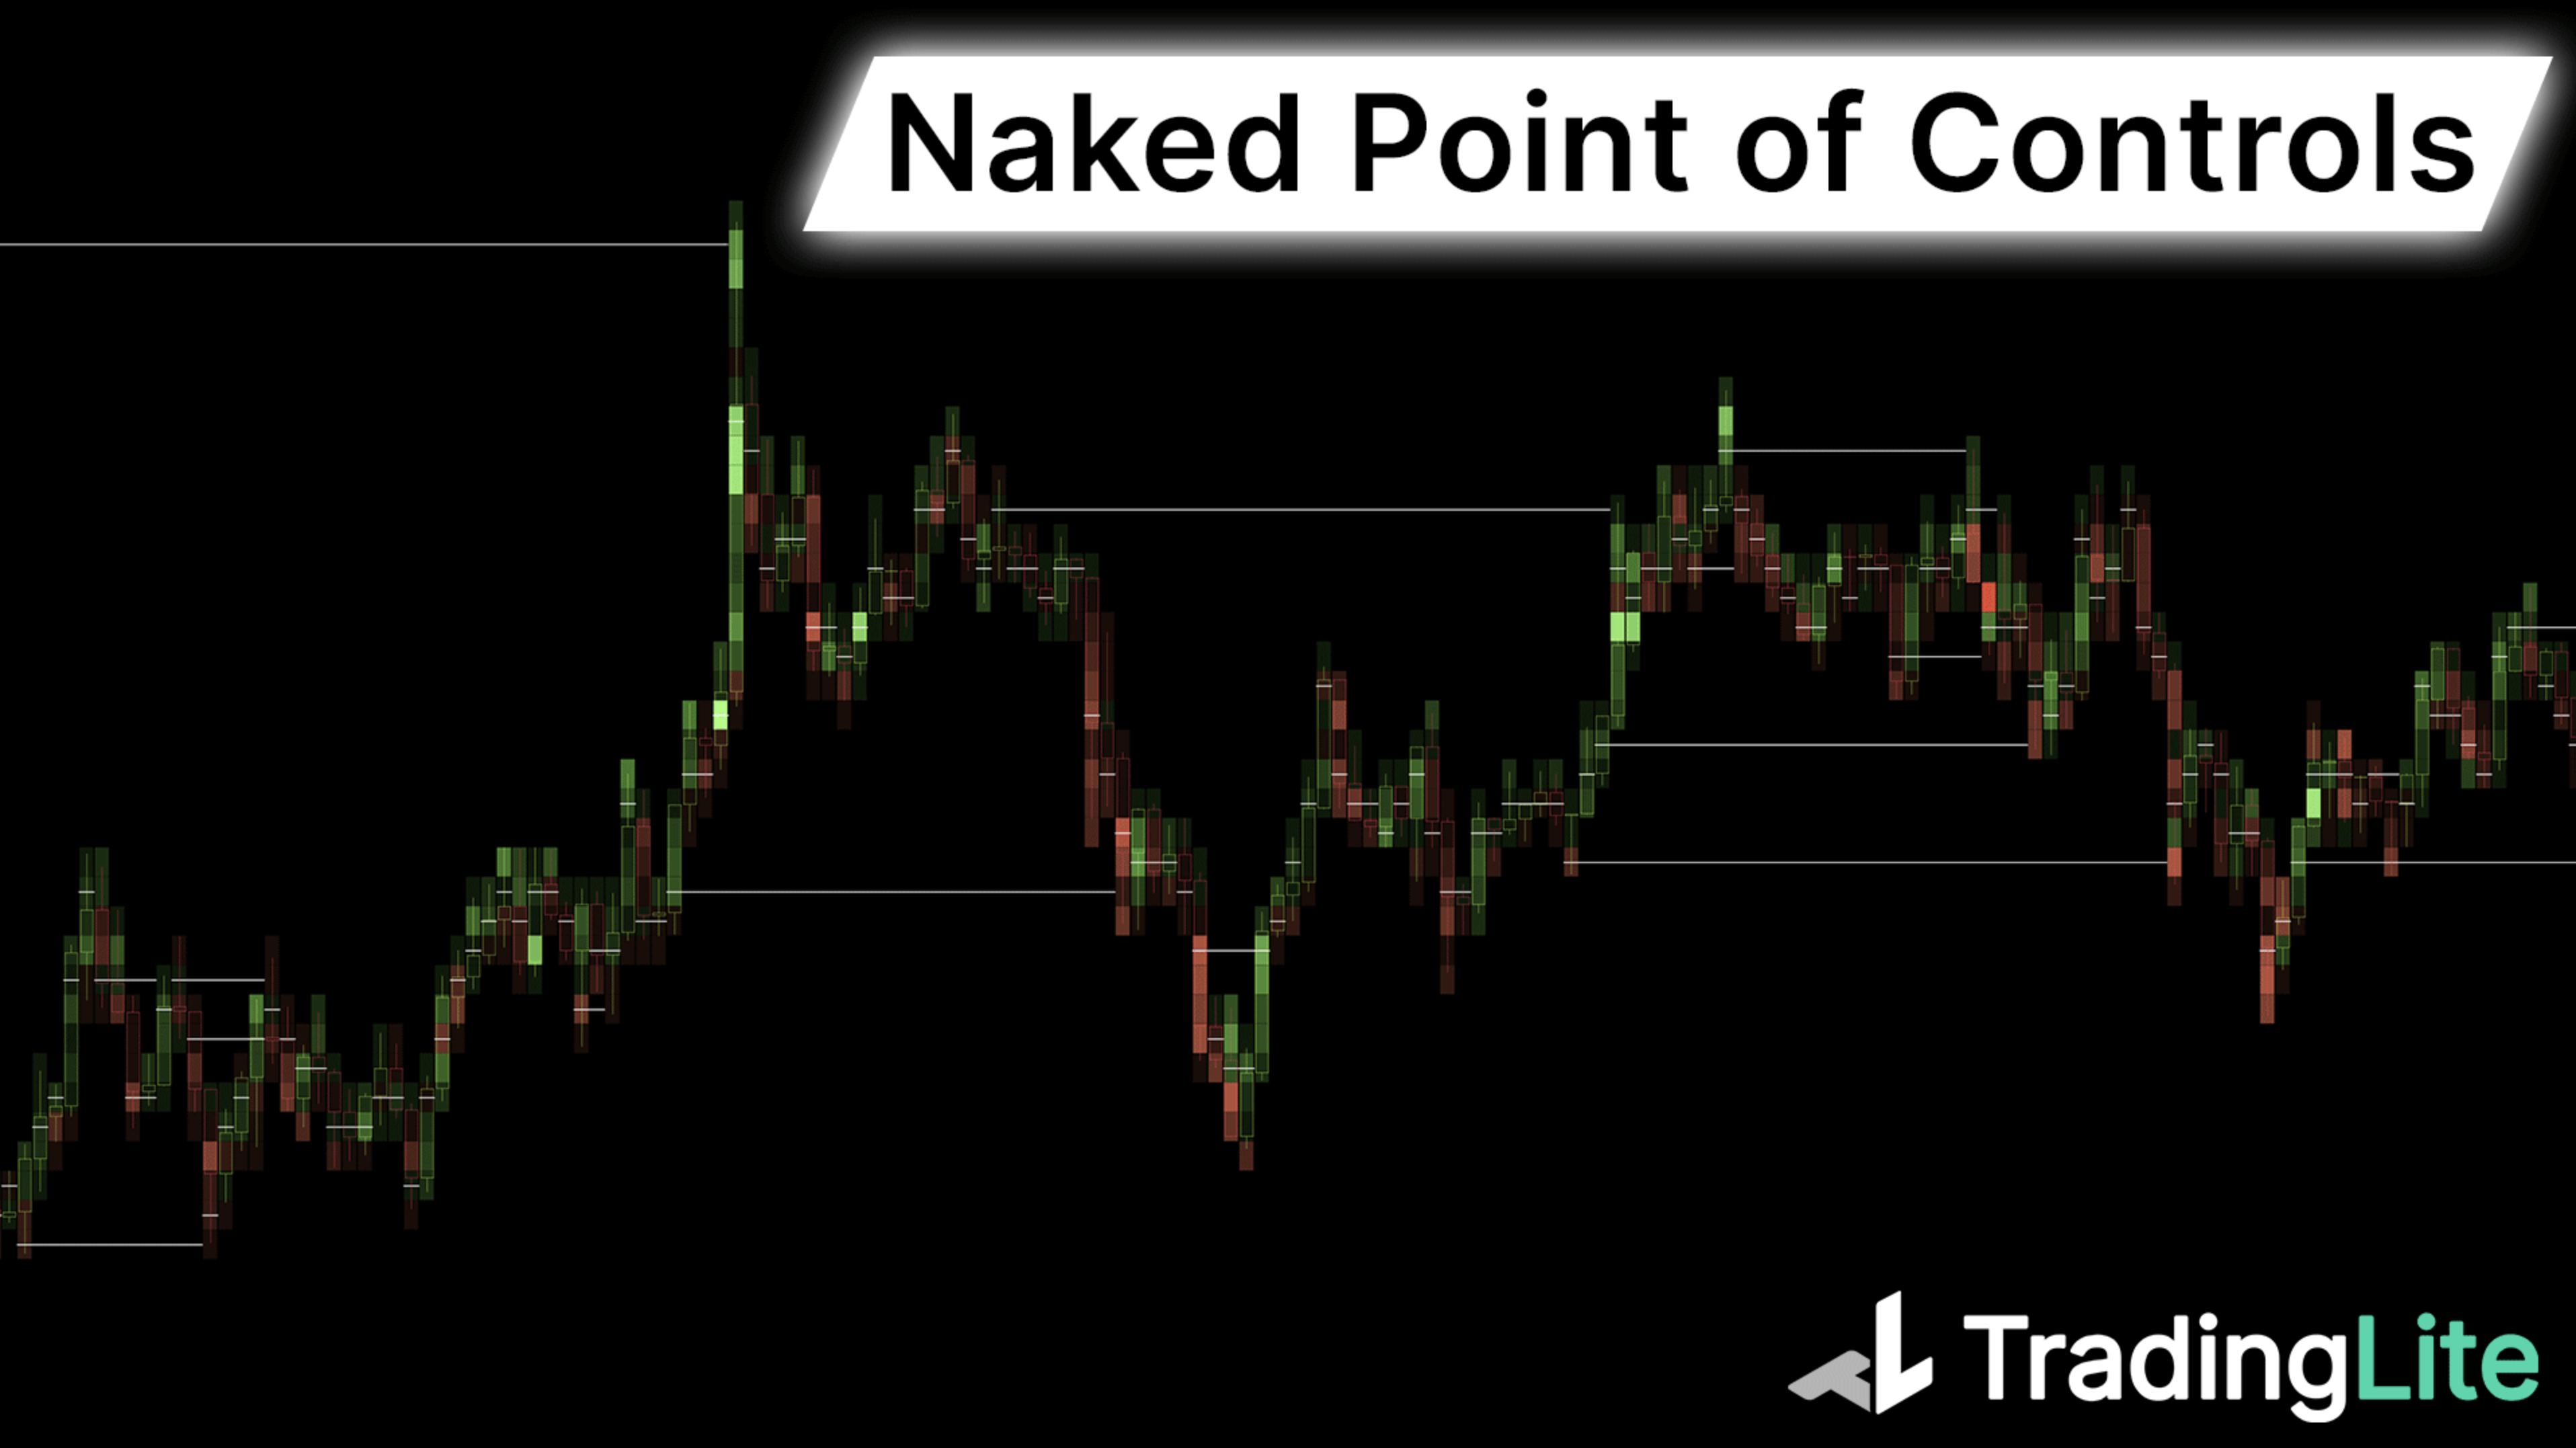
Building upon the Point of Control feature, when activated an option will appear to extend the POC.
'Doubled', will project the POC by one additional candle.
'Naked Extension', will project the POC indefinitely, until price revisits this previously identified high volume node.
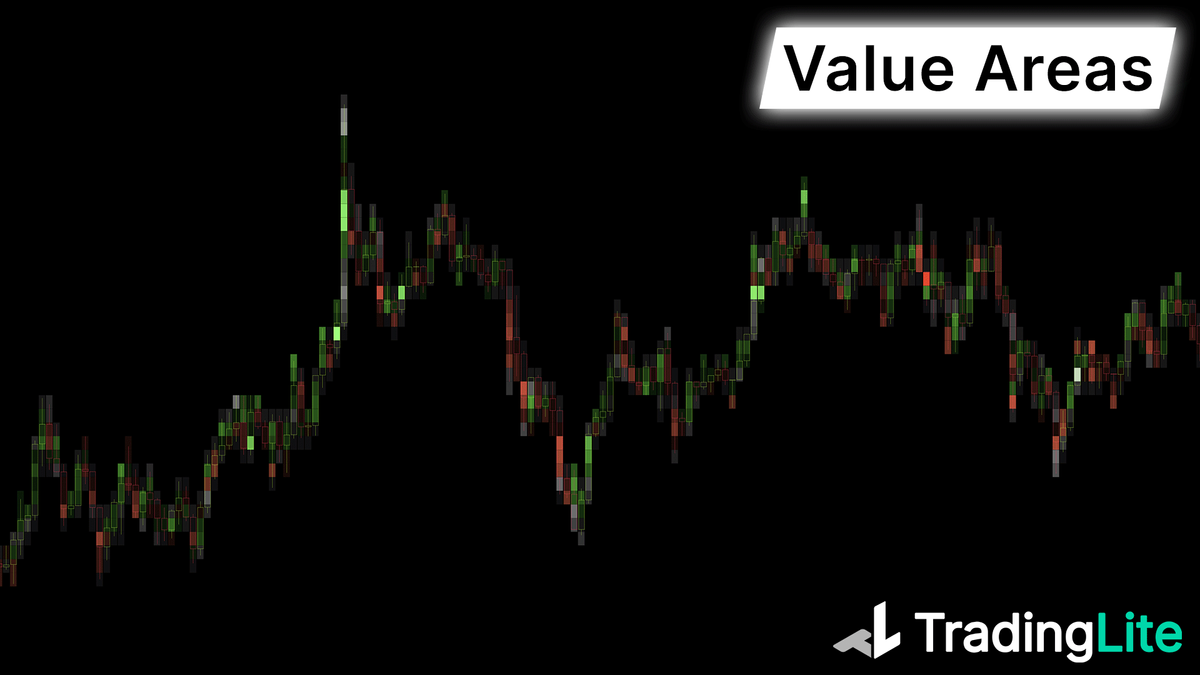
Enabling the Value Area will highlight the area in which the majority of the volume took place. The areas outside the Value Area will be color-less. This percentage value is configurable to suite your desired range. The brightness in comparison to the rows that fall outside the Value Area can also be configured.
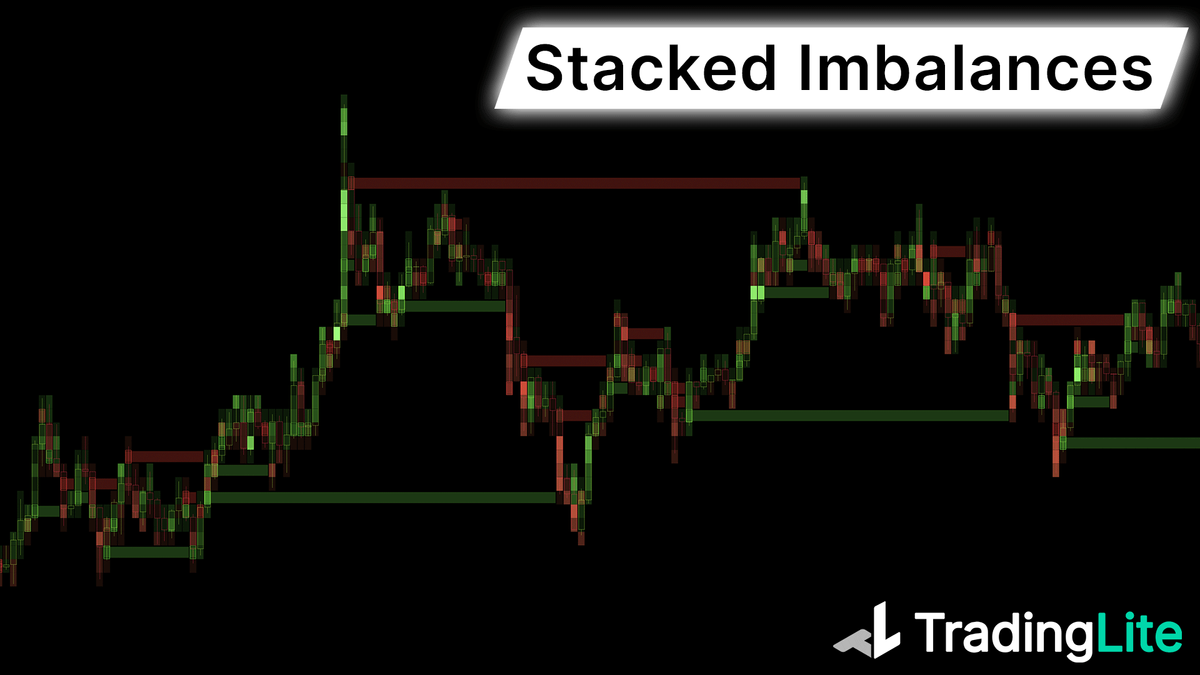
When enabled, Stacked Imbalances will extend the node with the imbalance indefinitely until price revisits this notable point of interest in the future.
Enabling this will highlight each row of the footprint cluster, in which the total volume exceeds your given threshold.
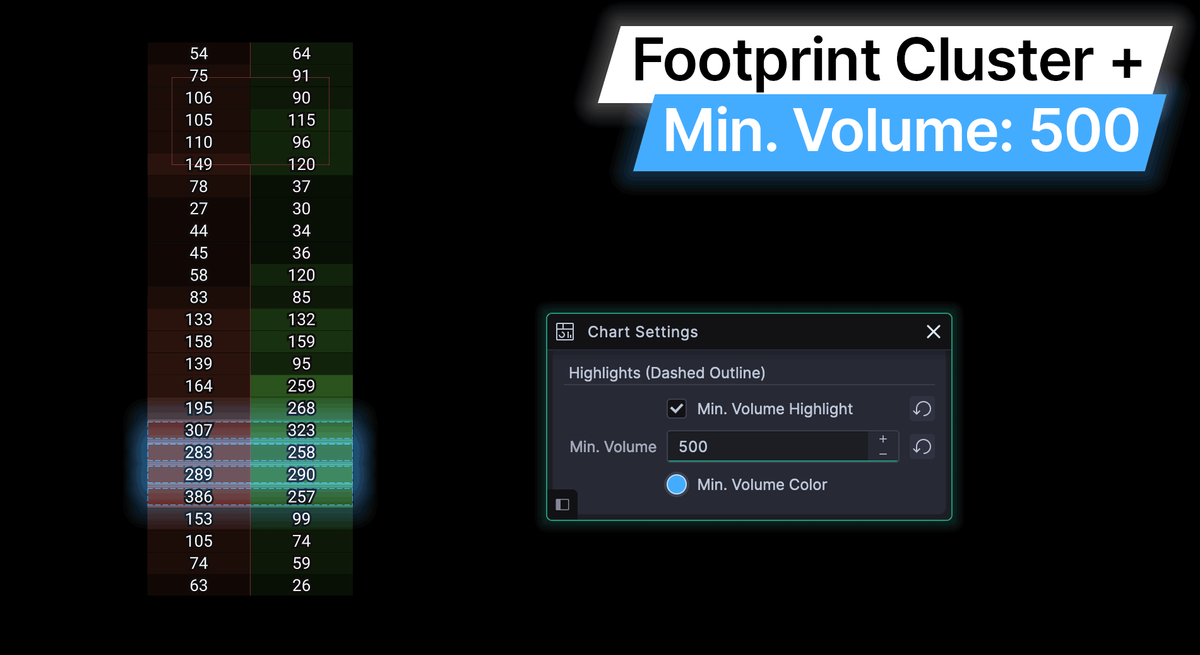
This is especially valuable when in Delta Mode, as a visual indicator of high volume, and therefore by extension, high interest by market participants at that particular price point in time.
Note: Regardless of delta value itself, if the total volume of the row exceeds your minimum volume threshold, the dashed visual highlight will be rendered.
Before you start charting, don't forget to take a look at TradingLite's Footprint Bar Statistics layer.
Footprint Cluster not your style? Confused between naked extensions and stacked imbalances? No idea what a footprint is? We have you covered below:
Was this page helpful?