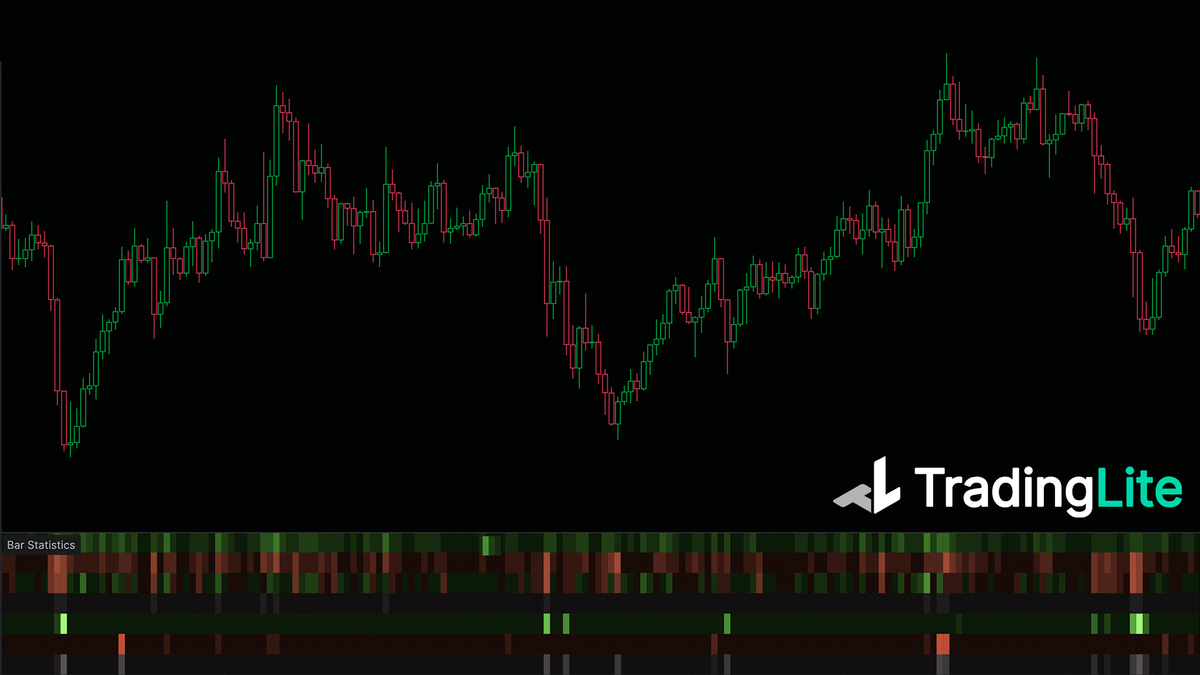
Footprint Bar Statistics
Footprint Bar Statistics is a numerical method of analyzing data. This can be useful in providing a quick method to summarize a variety of data.
Tags: To accompany TradingLite's range of order-flow tools, Footprint Bar Statistics is a numerical method of analyzing data. This can be useful in providing a quick method to summarize a variety of data.
Although numerical in nature, a color grading is applied to each of the configurable rows, allowing you to quickly identify point of interest, at a glance.
By default, the data within each column of the Footprint Bar Statistics is derived from each candle. Depending on the row itself, this may be the value for that particular candle in isolation, or a cumulative value based on either the session or the the candles in view.
Don't forget to check out TradingLite's full suite of order-flow tools including Footprint Cluster, Footprint Profile, TPO / Market Profile. There is also a Footprint Basics guide, along with a deeper Footprint Advanced article.
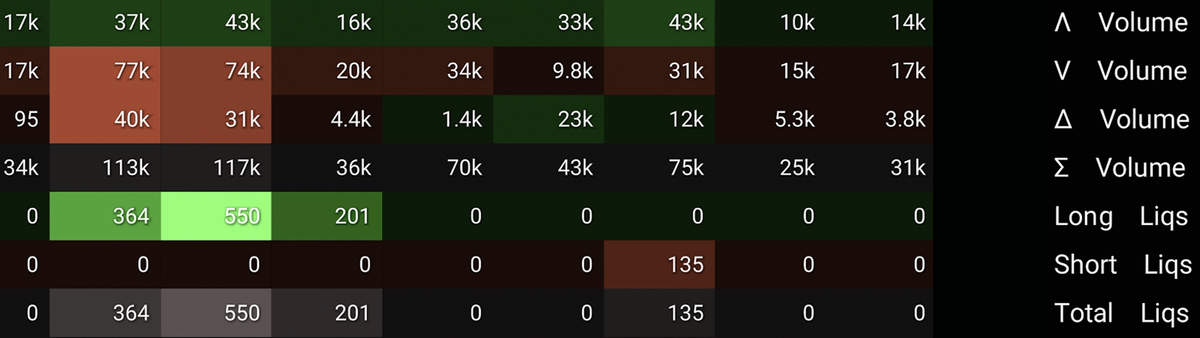
As explained above, each row of the Footprint Bar Statistics table represents a different value. Below, we provide an explanation of each of these rows.
The total value of market buy orders within the candle.
The total value of market sell orders within the candle.
The delta of market buy orders and market sell orders, within the candle. Market buys - Market sells.
The total value of both market buy orders and market sell orders, within the candle. Market buys + Market Sells.
The change in volume in the current candle, compared with the previous candle, expressed as a percentage.
The high price of the candle.
The low price of the candle.
The highest value of Open Interest within the candle.
The lowest value of Open Interest within the candle.
The total value of long liquidations within the candle.
The total value of short liquidations within the candle.
The total value of both long and short liquidations within the candle.
To enable TradingLite's Footprint Bar Statistics navigate to:
Indicators > Official Indicators > Footprint Bar Statistics
Note: The Footprint Bar Statistics indicator is only available for Gold subscribers. Upgrade today to take your trading to the next level 🚀
By default, each column within the Footprint Bar Statistics corresponds with each candle in view. If you wish to aggregate the data across candles, you can select one of the various 'Minimal Interval' inputs.
Those looking to change the appearance of the Footprint Bar Statistics can do so via the various options within the layer's settings. This includes the two sets of three primary colors used to create the 9 layers of color grading that is applied to the render.
Selecting and organizing the rows of the Footprint Bar Statistics layer to your preferences is quick and intuitive.
VisibilityThe visibility of each row of the Footprint Bar Statistics layer can be toggled on or off, via the Eye icon. ReorderingYou can also re-order each row by dragging and dropping to your preferred order. |  |
Want to learn more about all the other Footprint layers TradingLite has to offer? Check out these related articles below!
Was this page helpful?